


Every tool is free to use. Enter your email once and all five open.All resources
Transparent diagnostic modules on a lit base, each organising a separate signal into a measured core.
The GTM Audit

Find your biggest leak. Fix the right thing first.

Know where revenue is leaking, what it costs, and which system to build first. A 45-metric diagnosis with a plan your team can act on.

$5,000Fixed fee · Three weeks
No obligation to buy a build

Questions first? 15 minutes with a GTM engineer

Every leak in dollarsA diagnosis you can prioritize, not a maturity score.
One system to build firstA named priority, with boundaries and a baseline.
Yours to act onKeep the map whether or not you build with us.
What you leave with

Not another assessment. A buildable plan.

The audit tells you what is broken and what it costs. The Operating Map tells you which system to build, what it may do, and how to measure success.

Glass objects standing in for the Operating Map, the diagnostic and the other deliverables.
The core deliverable

Your Operating Map

The workflow. The priority. The boundaries. The baseline. One document that tells your team what to do next.

Conceptual illustration, not a client report.

  1. 01

    45-metric diagnostic

    A scored view across all four revenue domains.

  2. 02

    Peer benchmarks

    Compare your metrics with companies your size.

  3. 03

    Dollar-valued leaks

    See what each gap costs, not just where it sits.

  4. 04

    Prioritized roadmap

    Sequence the fixes by impact.

  5. 05

    AI-readiness assessment

    Find out whether your data can support AI at all.

  6. 06

    90-minute walkthrough

    Review the findings and Operating Map live with the senior engineers who ran your audit.

  7. 07

    30-day data room

    Keep access to everything produced during your audit.

The map is yours. Act on it with us or with your own team.

Buy the Audit · $5,000
An overhead view of a glass structure where a bright path runs past three rejected gates and ends at one gate marked with a check.
Real output, clearly labelled

See the actual output before you buy it.

The Test Report is the document that grades a system against your own historical cases before it goes live. The published example is run on VANDFORT’s own systems and is labelled as ours on the page. We have no client output to show yet, and we will not dress an illustration up as one.

What every run is graded on85% pass mark
  • Right data pulled
  • Right steps taken
  • Matches your judgment
  • Safe to act
A bounded engagement

Three weeks.
No black box.

You know what happens, what we need from you, and when the decision lands.

  1. Week 1

    Map what actually happens.

    Read-only access to your CRM and revenue tooling. We trace the real workflow, not the process document.

    Your partOne discovery call45 min
  2. Week 2

    Measure the gaps.

    45 metrics scored and benchmarked. Every revenue leak quantified in dollars.

    Your partFollow-up questions~1 hour
  3. Week 3

    Leave with the map.

    Findings and your Operating Map, walked through live with whoever will own the fix.

    Your partThe walkthrough90 min
~3¼ hrsof one person’s scheduled time
0changes made to your systems
3 weeksfrom access to Operating Map
What we measure

45 metrics.
Your whole revenue engine.

Not a maturity score out of ten. Named, measured, benchmarked metrics across four connected domains.

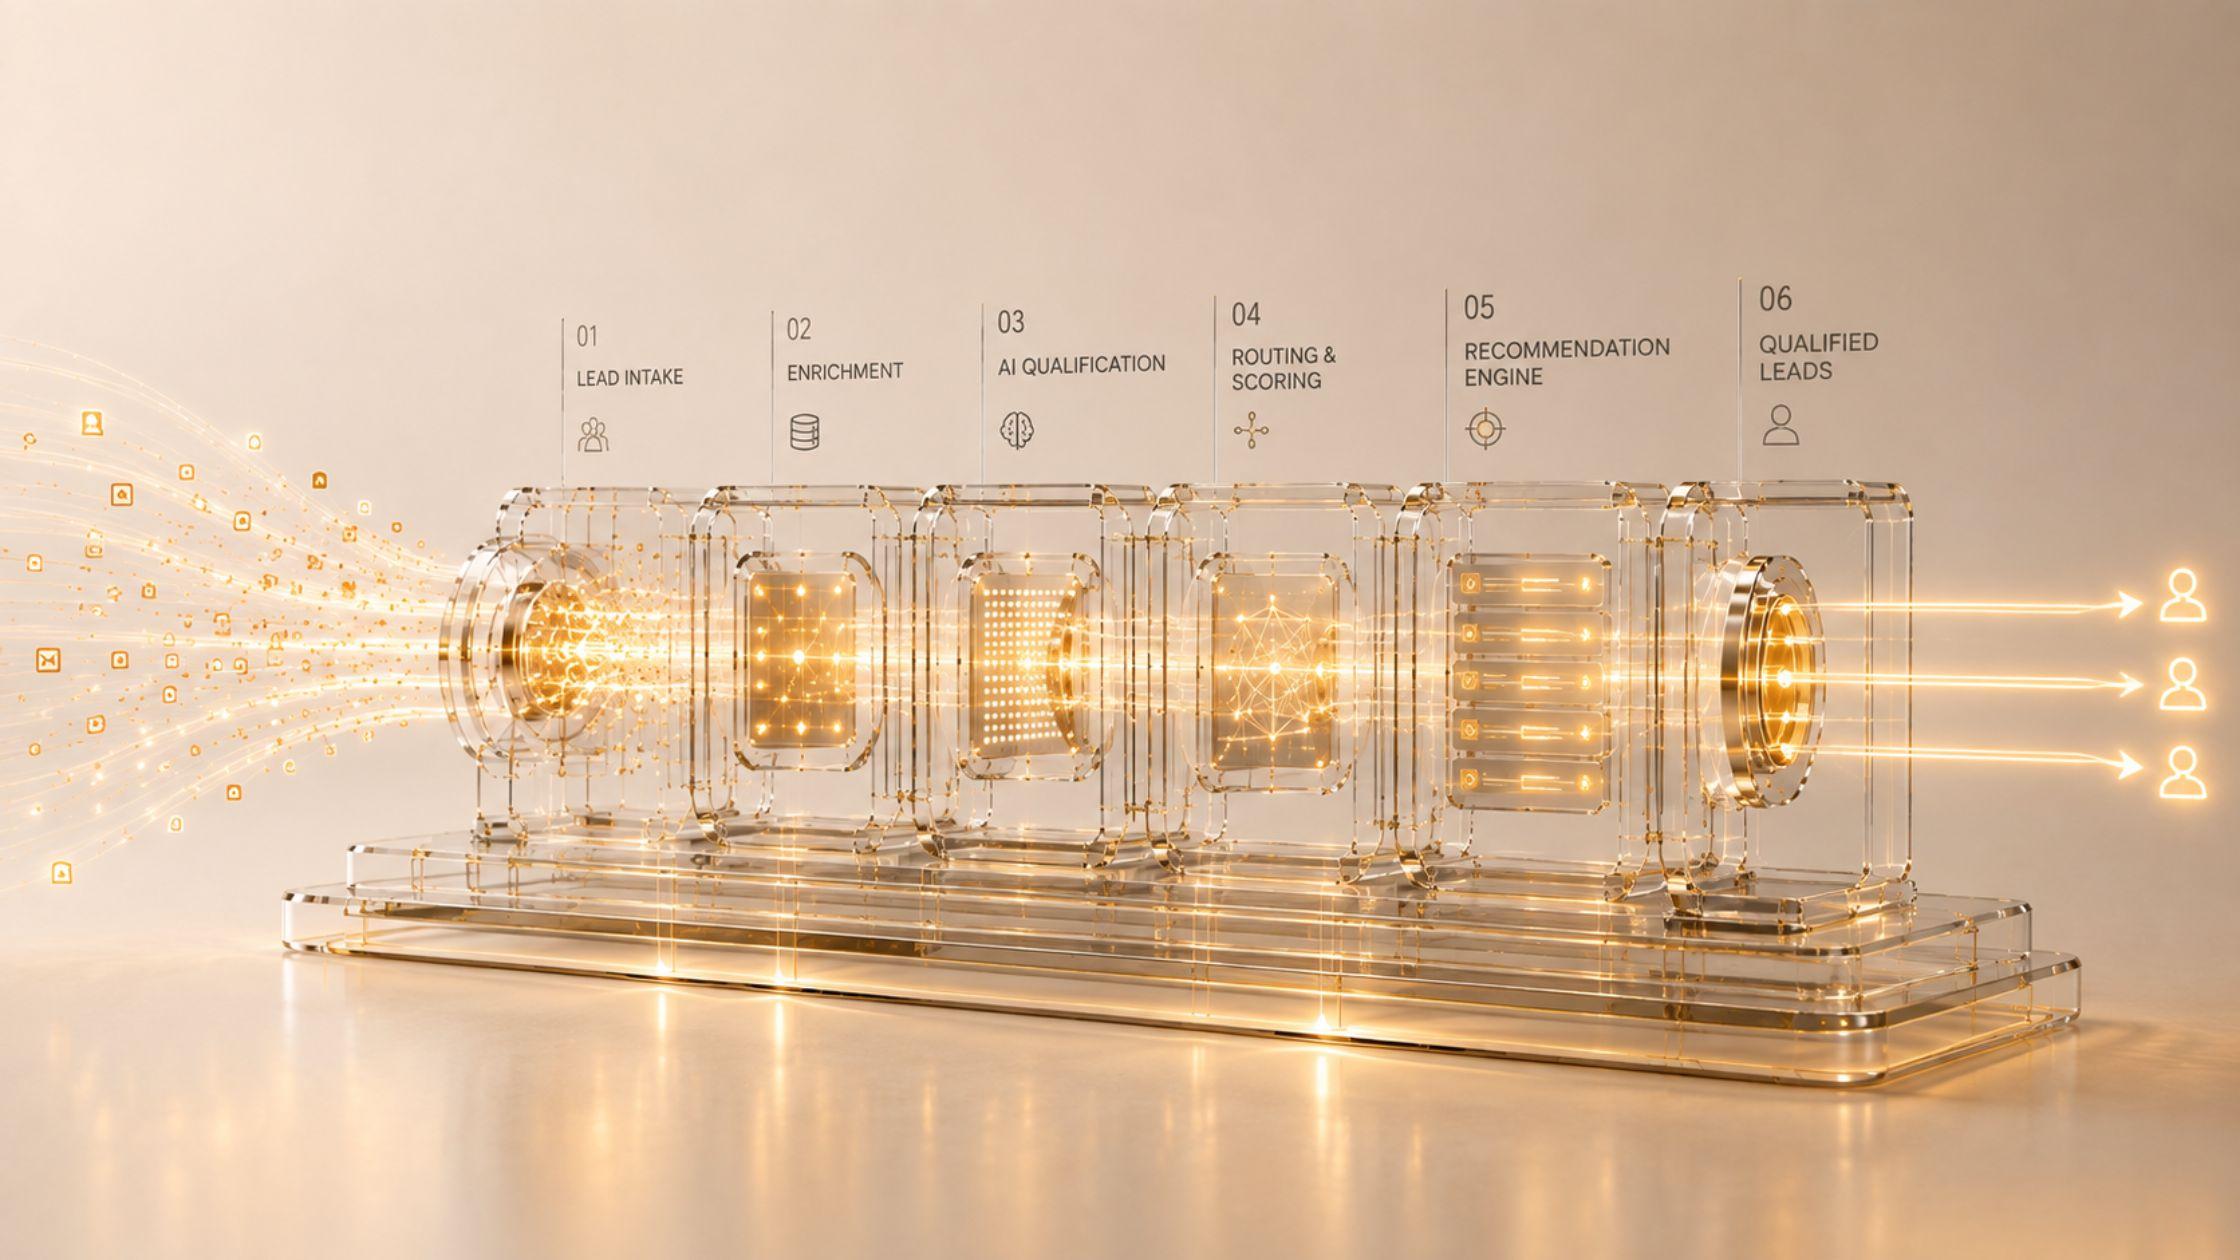
A glass intake manifold on a lit base, with scattered points of light entering from the left and resolving into a single ordered channel.
01 · GTM Operations

The acquisition engine

Leads rot for hours. Handoffs drop between teams. Outbound is spray-and-pray.

We measureLead response time, routing accuracy, form-to-CRM integrity, attribution, campaign-to-pipeline traceability.

Systems it can lead to


A narrow glass corridor lit from above, with a bright path running its length past a series of gates.
02 · Sales Operations

The deal execution layer

Forecasts miss. The pipeline is a graveyard nobody cleans.

We measureStage integrity, pipeline hygiene, forecast accuracy, quota and territory balance, comp plan signal.

Systems it can lead to
A closed glass loop lit from within, its channel circulating back on itself without a break.
03 · CS Operations

The retention engine

Churn arrives with zero warning. Renewals are guesswork.

We measureOnboarding handoffs, health score predictiveness, renewal runway, churn signal lead time.

Systems it can lead to
A layered glass core lit from the centre, with fine traces converging on it from every side.
04 · Revenue Intelligence

The analytics brain

Board decks take days to assemble. Dashboards disagree with each other.

We measureMetric agreement, reporting lineage, board pack assembly cost, data readiness for AI.

Systems it can lead to
An answer, not an automatic upsell

Three ways this ends.
We’ll tell you which.

01 / Build

One recommended system

A named system with clear boundaries and a metric to move. Tested against your own history before it goes live.

02 / Prepare

Fix the data first

Cleanup, enrichment and routing. If AI is not the right next step, the audit says so.

03 / Hold

“Don’t spend money yet”

You keep the map, benchmarks and baselines. We would rather lose the build than sell you the wrong one.

Scattered signals entering a glass diagnostic chamber and leaving it as one clear path.
Your data, your control

Diagnosis does not
mean disruption.

We need to understand your systems.
We do not need to change them.

  • Read-only. Nothing changed.

    Not a record, workflow or field.

  • Anonymized before analysis.

    Use the CRM Anonymizer before sharing data. Your file stays in your browser while using the tool.

  • A 30-day data room.

    Deletion on request at any time.

  • Your data does not train models.

    Nor a benchmark set or prompt library.

Before you decide

The practical questions.

Is it really $5,000, flat?

Yes. A fixed fee for the three-week audit and its deliverables. No scoping call is required.

Am I obligated to buy a build afterwards?

No. The audit stands alone. You keep the Operating Map, benchmarks and baselines, and your team can act on them without us.

What if my data is not ready for AI?

The audit says so. A Data Readiness Sprint may be the right next step, with no AI in it.

What if you recommend doing nothing?

That is a legitimate outcome. You still leave with the map, peer benchmarks and current metric baselines.

Who actually does the work?

Senior forward-deployed engineers, backed by a team of GTM and RevOps professionals with over 20 years of experience. The people who diagnose are the people who build. There is no account-manager handoff.

How much of our time does this take?

Plan for a 45-minute discovery call, roughly one hour of follow-up, and a 90-minute walkthrough: about 3¼ hours of scheduled involvement, plus arranging read-only access.

When can we start?

Ask us about current availability. We will confirm timing rather than promise a start date this page cannot verify.

Still have a question? 15 minutes with a GTM engineer

The GTM Audit

Stop guessing where to invest next.

A diagnosis in dollars. A priority you can defend. A map your team can use.

$5,000Three weeks
Fixed fee · Standalone

Questions first? 15 minutes with a GTM engineer